RanMarine Communications – October 2026
This summer, the number of official swimming locations in the Netherlands with a health warning more than doubled in five weeks, rising from 46 at the end of June, to 104 by the end of July. Blue-green algae thrived in the heat, while heavy summer storms washed sewage overflows into local waters, as reported by NL Times.
For those responsible for managing these waters, none of this was a surprise. Water authorities, municipalities, and port operators sample their water regularly, send samples to accredited labs, and often run fixed probes that log data around the clock. They know their water well. However, they also know that a sample only describes one spot at one moment, and conditions can change within a few dozen metres.
At RanMarine, we look beyond single points to map the entire body of water.
Why one point is not always enough
Grab samples remain an essential part of water science. They are accredited, precise, and measure parameters that field sensors cannot, such as bacteria and toxins. However, a laboratory sample only reflects the water collected in that single container at that exact moment. Stationary probes log continuous, real-time data, but only for the specific spot where they are installed. Satellites, such as the Copernicus lake water-quality service, offer a broad overhead view, but only provide updates every ten days.
Water is rarely uniform. Parameters like pH, dissolved oxygen, temperature, and conductivity change across short distances due to currents, shading, depth, and runoff. A 2021 study on cyanobacteria in Clear Lake, California, published in Frontiers in Environmental Science, showed that algal blooms varied over distances of 70 to 175 metres. That level of variation falls between satellite pixels and is easily missed by individual sampling points.
This is why taking readings every few seconds while moving across the water changes the picture. Instead of relying on isolated data points, high-frequency spatial sampling generates a continuous dataset across the entire surface area. It connects the dots between fixed locations, revealing localized plumes, sudden gradients, and mixing zones that would otherwise go unnoticed.
The EU Water Framework Directive highlights the need for this level of detail. Alongside routine monitoring, it specifies investigative monitoring when the cause of a problem is unknown or when the impact of a pollution event needs to be mapped quickly. With the European Environment Agency reporting that only 37% of Europe’s surface waters currently meet good ecological status, accurate spatial data is vital for targeted action.
If you would like a refresher on basic parameters, from algae to dissolved oxygen, read our earlier article, Why water quality matters.
Measuring while moving
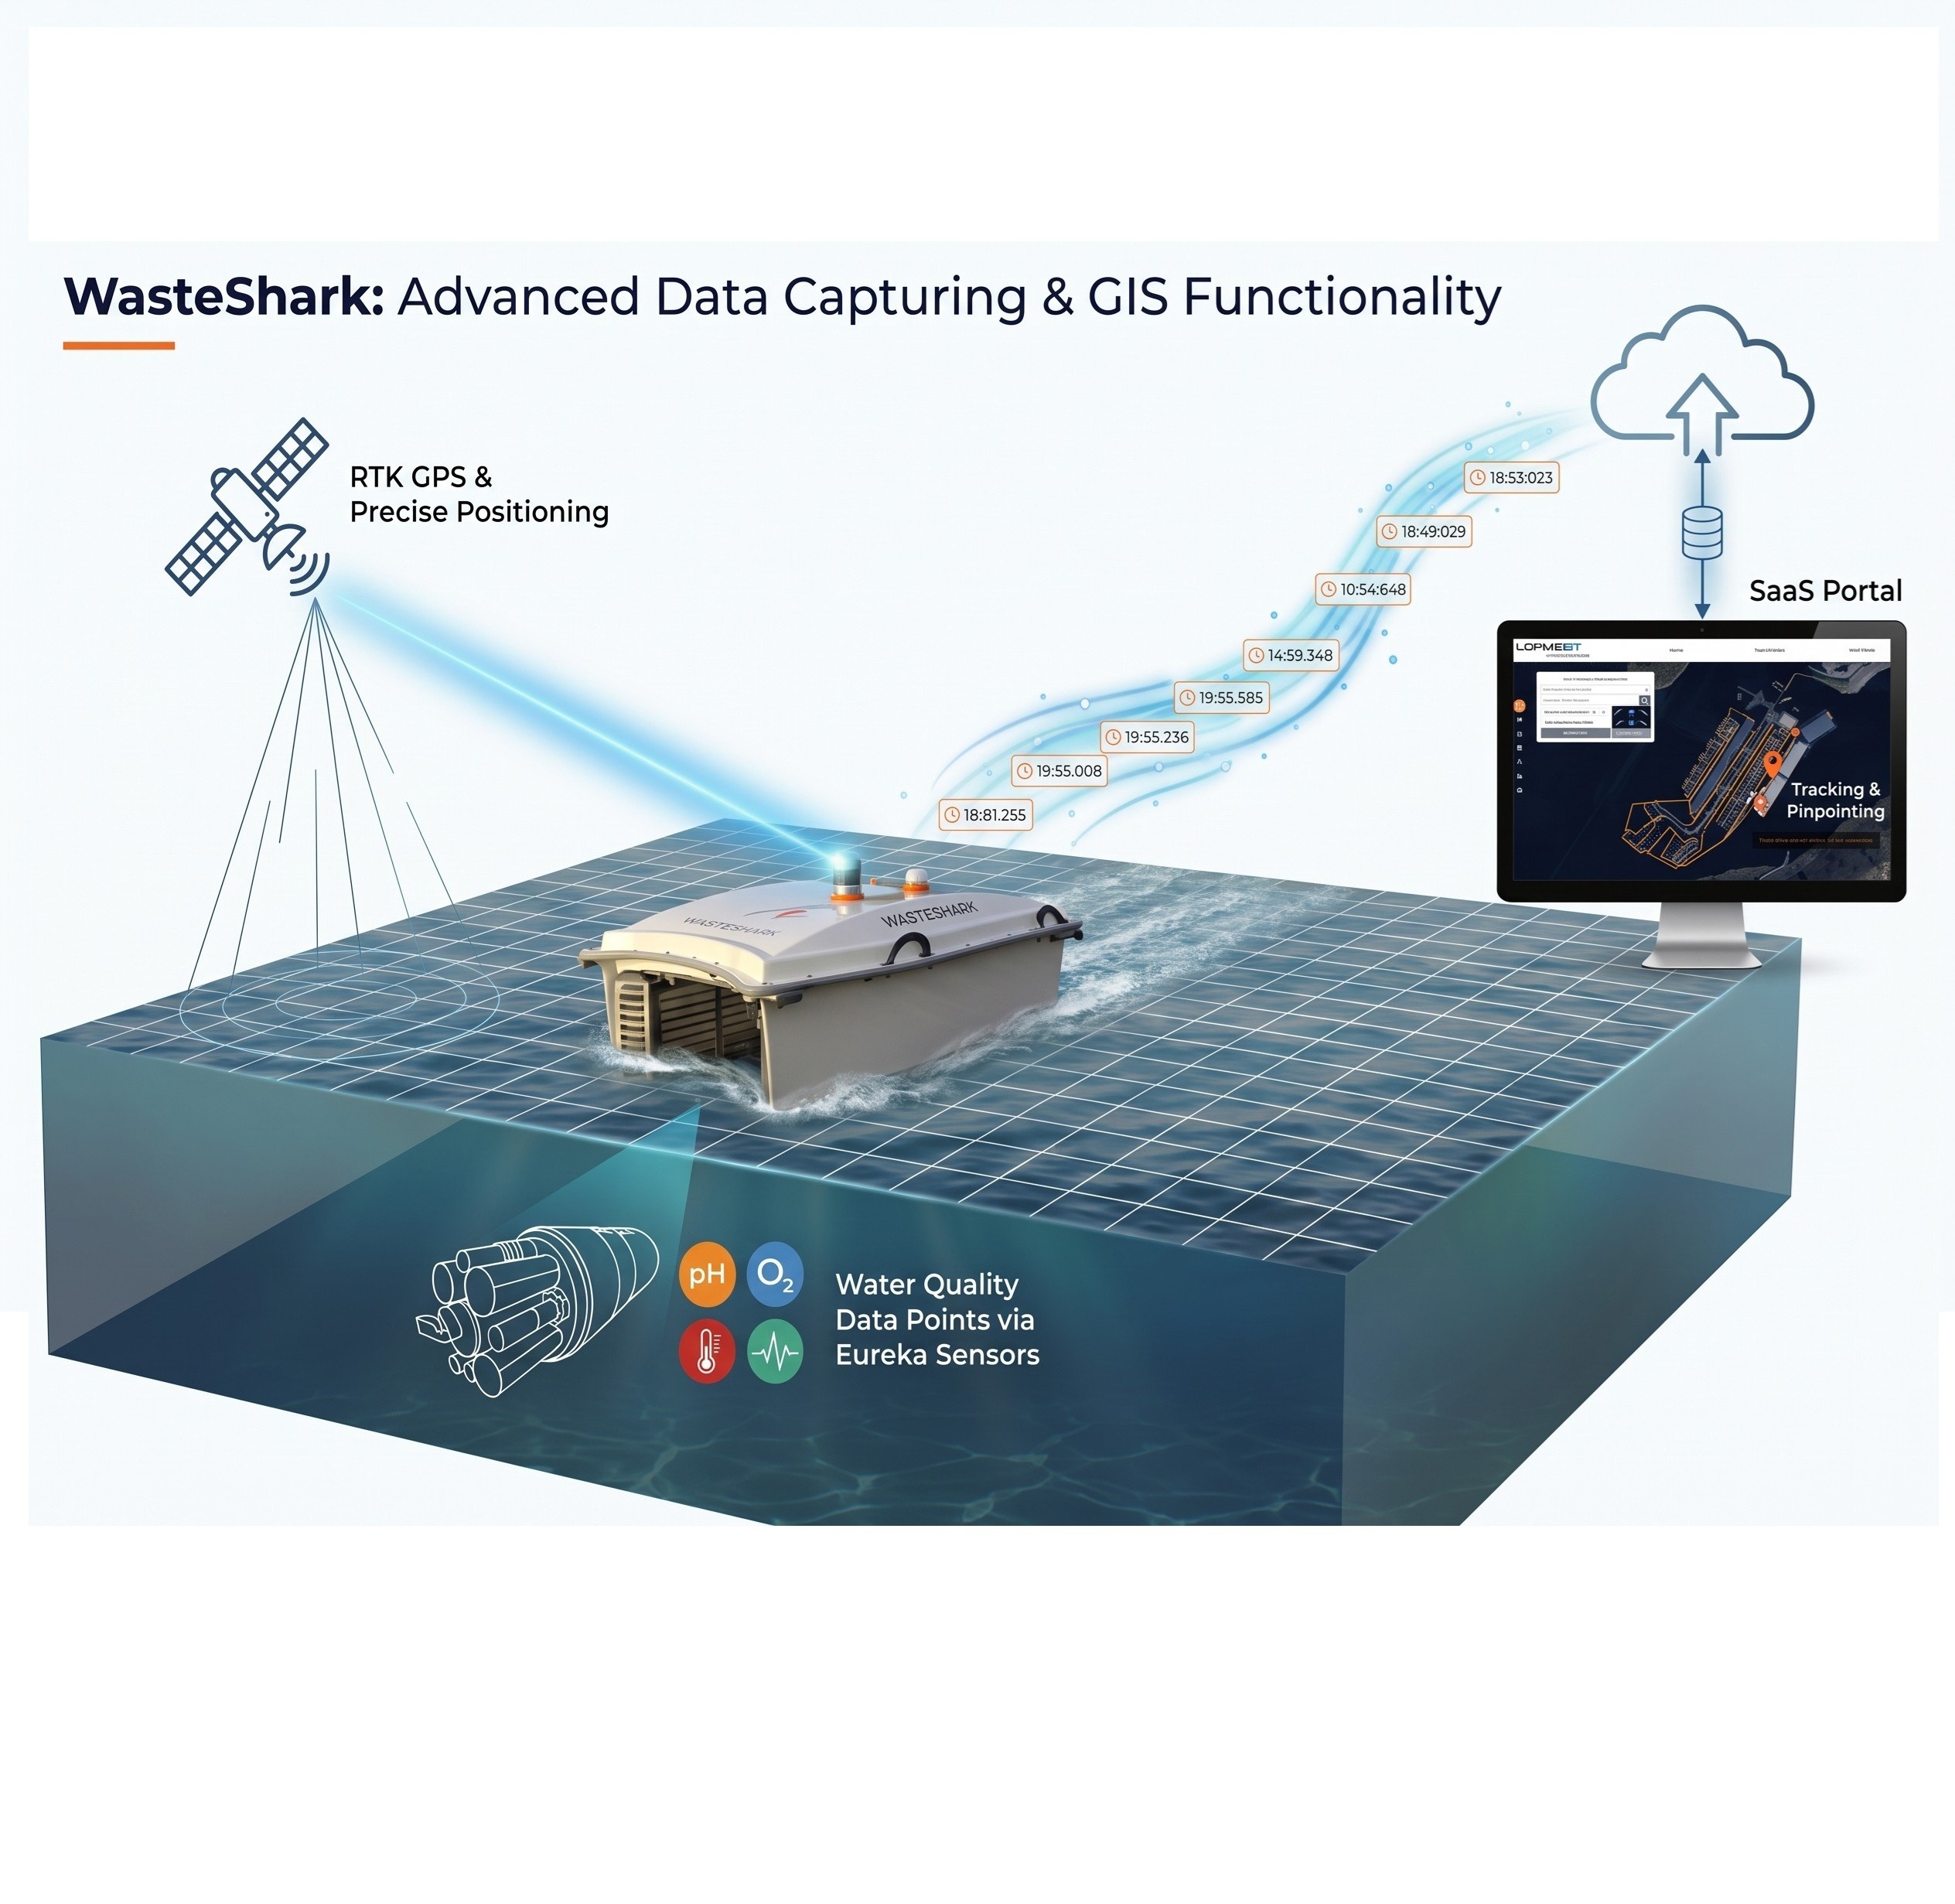
This is where the WasteShark provides additional value. Best known for collecting floating waste, the WasteShark can also carry professional multiparameter probes from Eureka Water Probes, the same instruments many monitoring teams already use. Any sensor from the Eureka range can be integrated, including temperature, pH, conductivity, dissolved oxygen, turbidity, chlorophyll, blue-green algae, nitrate, and ammonium.
As the WasteShark moves across the water, it logs a reading every minute and tags each one with a precise GPS location. The result is a map of the entire water body. Teams can use it to:
- Locate the source of a discharge instead of guessing between two sampling points
- Check whether a fixed probe or sampling point is representative before installation
- Map the extent of a spill or overflow within hours
- Compare the same route before and after an intervention, as well as over time
- Determine where to take the next lab sample
The survey does not replace the lab. It shows you where the lab should take samples.
A practical example
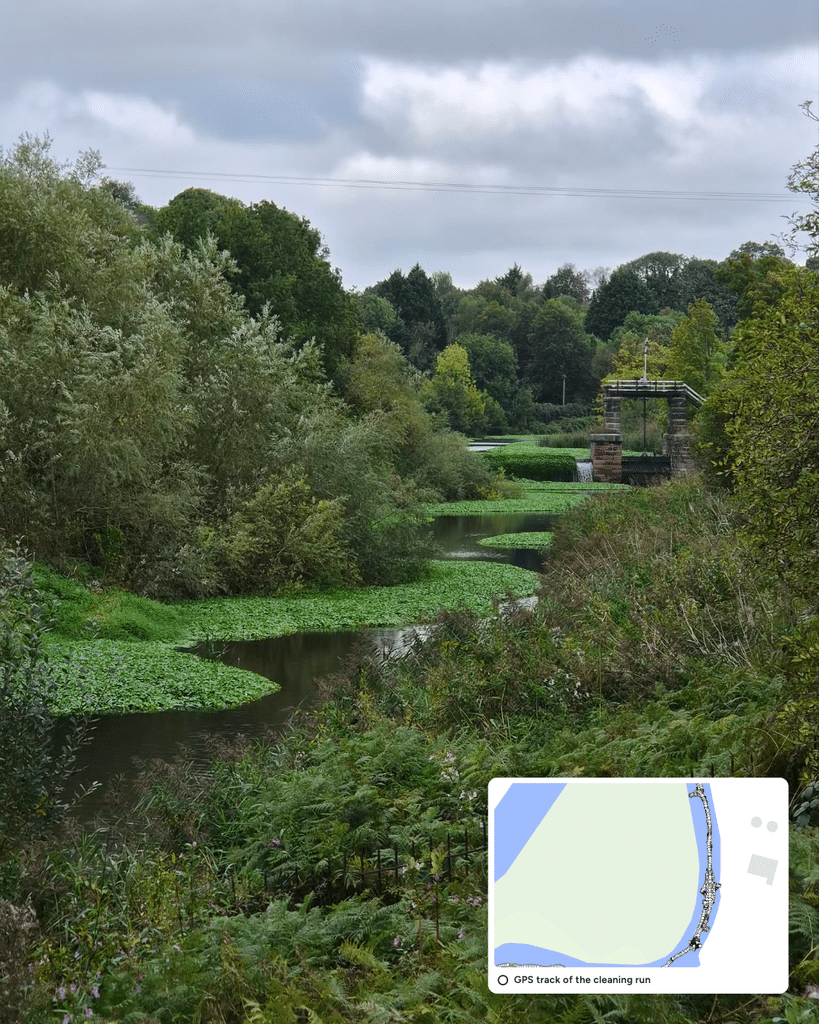
Recently, a WasteShark carried out a survey where, at first sight, the water appeared stable. Temperature, pH, and oxygen readings were all within normal ranges. A single grab sample would have indicated no issues.
The spatial map revealed a different picture. At one end of the channel, the survey identified a warm inflow, approximately 2 °C warmer than the surrounding water, with higher conductivity. It appeared on the first pass and was confirmed on subsequent passes. Downstream of the inflow, conductivity remained elevated, showing that its effect carried along the channel. The survey also detected a small, localized area of high pH near one bank, which returned to normal within a few metres.
A fixed probe at either end of this channel would have missed both the inflow and its downstream impact. The operator now knows where to take a lab sample and where to investigate the source.
From data to decisions
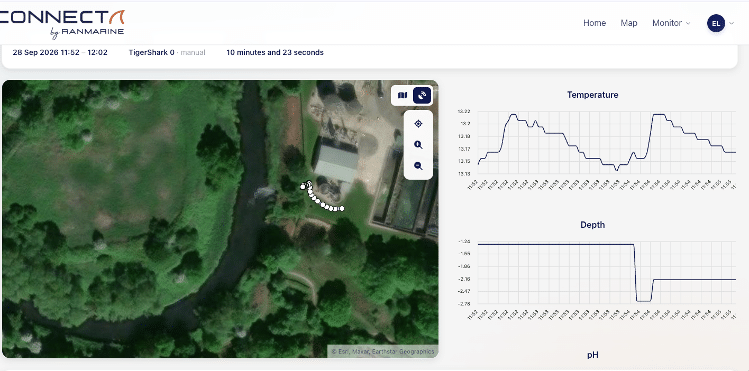
All readings feed into RanMarine Connect, our data platform, where they appear as heatmaps, trend graphs, and exportable reports. Repeating the same route weekly or monthly provides a clear view of how a water body changes over time.
This approach suits water authorities, municipalities, ports operating under environmental permits, and environmental consultants who require more field data. Because the vessel also collects floating waste, water monitoring can run alongside cleaning operations.
We have previously written about how this approach supports sheltered waters where oxygen runs low in Combating oxygen depletion in sheltered waters, and about our CyanoShark deployment at the Challenge Almere-Amsterdam triathlon, where it monitored blue-green algae during the European Championship.
Clean water starts with knowing your water
Good decisions about water rely on clear data, and clear data comes from measuring in the right places. The water between your sampling points contains critical details. We can help you gather them.
To see how an autonomous survey compares with your existing monitoring data, contact our team or learn more about our water quality solutions.